
Reports & dashboard
Dashboard
Section titled “Dashboard”The dashboard is what you land on when you open Kiste — a quick read on the state of your warehouse.
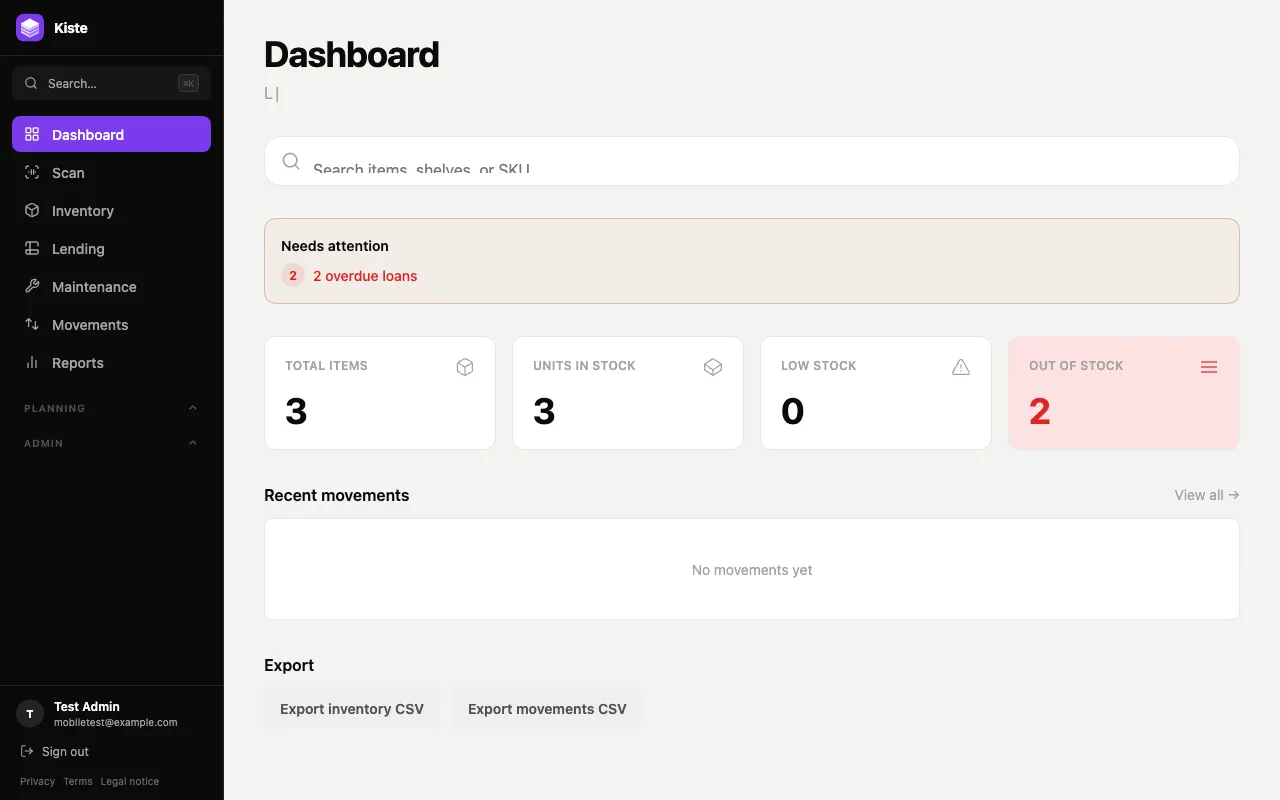
- Needs attention — appears only when there’s something to flag: overdue active loans, or items currently marked broken/maintenance. Click through to jump straight to them.
- Stat cards — total items, total units in stock, low-stock count, and out-of-stock count. The low-stock and out-of-stock cards turn red once they’re non-zero.
- Low stock items — every item at or below its configured minimum quantity.
- Recent movements — the last 10 stock movements: item, type, quantity (with a +/− sign), who did it, and when.
- Export — download your full inventory or movement history as CSV.
- The search bar at the top searches items, shelves, and SKUs from anywhere.
Reports
Section titled “Reports”Reports goes a level deeper, with four views:
- Top 10 most loaned items — a bar chart ranking items by how often they’ve been lent out, so you know what’s actually in demand.
- Inventory status breakdown — a donut chart across Available / Lent / Broken / Maintenance.
- Movement trend (last 30 days) — daily stock-in vs. stock-out over the last month, so you can spot unusual spikes.
- Items never loaned — everything in inventory with zero loan history, which is often the first place to look when deciding what to declutter.